By Arjan Kole
The impact of an air filter to the system airflow and thermal performance is a study that is typically carried out at the initial stages of the design phase. At that point in time, hardware is usually not available for testing. Therefore the use of simulation tools is very suitable to investigate this.
An example of a common air filter is shown below. The air filter is shown in light yellow and the support structure in blue/purple.
 Figure 1. Air filter (in yellow) with support frame |
The air filter consists of the porous filter material and is supported with a metal structure. This structure is located downstream of the filter. The open area of the supporting structure is reducing the effective area of the air filter and this increases the air velocity going through the air filter material. As a result, the pressure drop over the air filter is increased with the addition of the support frame. A typical airflow pattern is presented in Figure 2. One can see the increased velocity through the openings in the support frame, compared to the uniformly distributed approach velocity. |
A numerical study has been conducted to investigate the accuracy of pre-settings in Flotherm. Three different scenarios are investigated:
|
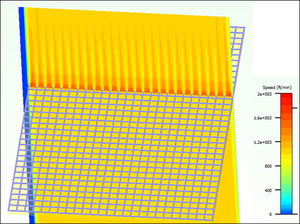 Figure 2. Airflow Pattern with support frame |
The differences in the settings of the ‘resistance attribute’ are shown below in Figures 3a, 3b and 3c:

The results of the pressure drop measurements over the air filter + support frame are shown below in Figure 4.
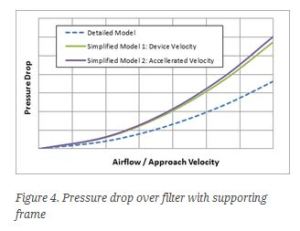
The results indicate that the simplified models over-predict the pressure drop of the air filter + support frame by more than 50 percent. The settings in the software to incorporate the reduced open area, without modeling the support frame in detail provide no good representation of the air filter + support frame.
Summary
It is advised to create a separate model of the detailed air filter + support frame construction and determine the pressure drop characteristics curve. Having said this; as for all simulations, it is recommended to verify results with actual measurements. In many cases, a supporting frame could be made by prototyping and the airflow resistance of this assembly with the filter material can be measured with the help of an airflow bench.

There is definately a lot to know about this subject.
I like all the points you made.
LikeLike